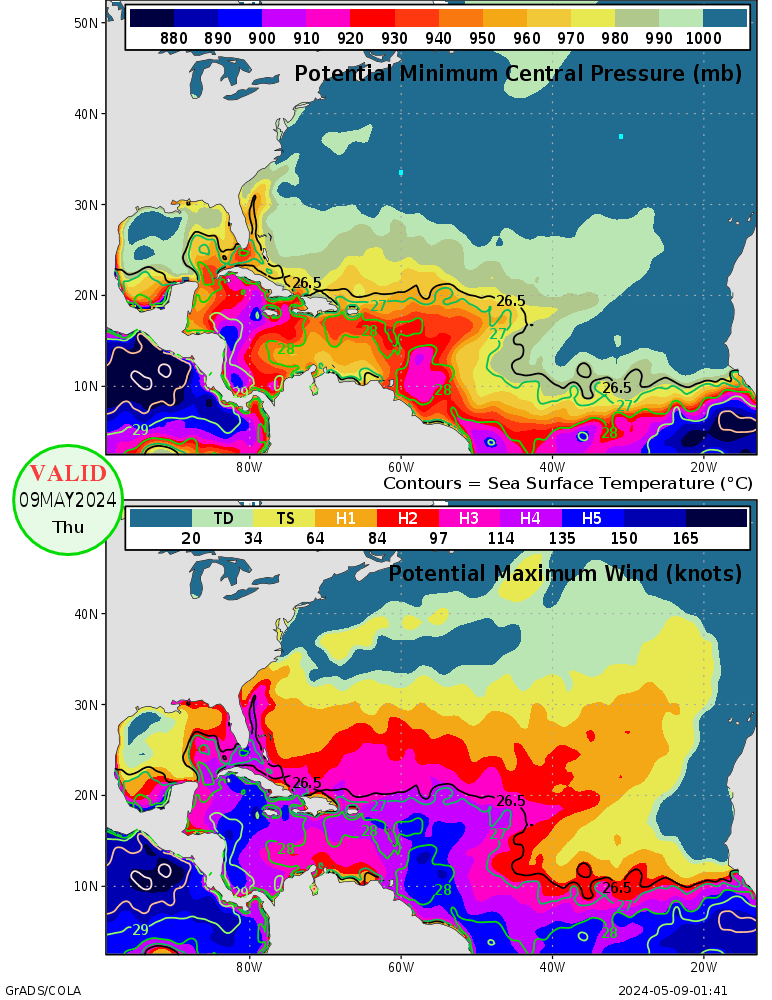
Saffir-Simpson Scale
| Type | Category | Pressure (mb) | Winds (knots) |
Winds (mph) |
Surge (ft) |
| ionDepress | TD | ----- | < 34 | < 39 | |
| Tropical Storm | TS | ----- | 34-63 | 39-73 | |
| Hurricane | 1 | > 980 | 64-82 | 74-95 | 4-5 |
| Hurricane | 2 | 965-980 | 83-95 | 96-110 | 6-8 |
| Hurricane | 3 | 945-965 | 96-113 | 111-130 | 9-12 |
| Hurricane | 4 | 920-945 | 114-135 | 131-155 | 13-18 |
| Hurricane | 5 | < 920 | >135 | >155 | >18 |
NOTE:Pressures are in millibars and winds are in knots where one knot is equal to 1.15 mph.


CLICK ON MAP FOR LOCAL RADAR


|
Map Details
Description:
The
Hurricane Atlantic Satellite image shows clouds by their temperature
over the Atlantic Ocean. Red and blue areas indicate cold (high) cloud
tops. |


|
Map Details
Description:
The
Hurricane Atlantic Satellite image shows clouds by their temperature
over the Atlantic Ocean. Red and blue areas indicate cold (high) cloud
tops. |


|
Map Details
Description:
The
Hurricane Atlantic Analysis image show the current surface features
(highs/lows/fronts/tropical cyclones) in the Atlantic Ocean. |


|
Map Details
Description:
The
Hurricane Pacific Analysis image shows the current and forecast
positions of any active tropical cyclones in the central and eastern
Pacific Ocean. |