LOCAL TIME - GMT / UTC

http://images.worldnow.com/images/myweather/maps/sector/us-il/radar/d505x380/loop.gif

(c) images.worldnow.com


Indiana Heat Index Map

 NOAA's National Weather Service

Heat Index


heat chart


Indiana Relative Humidity Map

 Indiana Relative Humidity Map

Indiana Ultraviolet Index Forecast Map

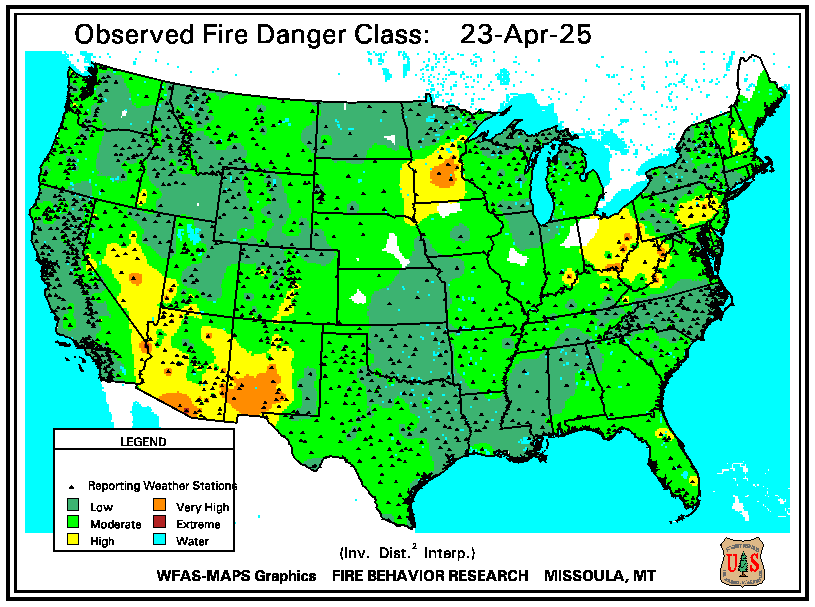
http://www.wfas.net/images/firedanger/fd_class.png 

Latest Excessive Rain Outlooks

CLICK ON MAP FOR LARGER VIEW


Day 1 Excessive Rainfall Outlook

Day 2 Excessive Rainfall Outlook

Day 3 Excessive Rainfall Outlook

 Day 1 Excessive Rain  Day 2 Excessive Rain  Day 3 Excessive Rain


AQI Animation - 
http://www.epa.gov/airnow/today/anim_aqi_mi_in_oh.gif
 
AQI: Good AQI: Moderate AQI: Unhealthy for Sensitive Groups AQI: Unhealthy AQI: Very Unhealthy AQI: Hazardous

Note :  drought maps are updated once a week 

US Drought Monitor

 http://www.in.gov/dhs/files/burn-ban/burn-ban-map.png?_AVOID_CACHE_=1289722353324

Make a Free Website with Yola.